Python绘图 |
您所在的位置:网站首页 › python 三维数据绘图 › Python绘图 |
Python绘图
|
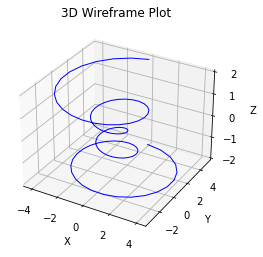
本节内容主要学习如何使用Python的Matplotlib库绘制3D Wireframe Plots(三维线框图)并调整线条的样式、颜色、粗细以及图形的其他属性,这种三维线框图通过连接数据点之间的线段来表示数据的形状和结构,并在3维的图像上展示出来。 1. 3D Wireframe(三维线框图)3D Wireframe Plots(三维线框图)是一种用于可视化三维数据和形状的图形表示方法。它通过绘制数据点之间的连接线来展示数据的三维结构和形状。每个数据点都有三个坐标值(x,y,z),线段连接这些点以形成网格状的结构。每个连接线代表数据点之间的关系,并形成一个网格框架。 我们可以用其可视化数学函数,直观地展示出函数在空间中的变化;还可以用其可视化一些气象数据,生物数据,地质数据,计算模型等。能够帮助我们理解和分析数据的空间特征,比如形状、曲线、边界等。此外,通过调整线条的粗细、颜色和样式,可以进一步突出或区分不同的数据特征。 在Matplotlib中,可以使用plot_wireframe函数来绘制三维线框图。该函数接受三维坐标点的数组作为输入,并根据点之间的连接关系绘制线条。接下来我们先简单演示一下: import numpy as np import matplotlib.pyplot as plt from mpl_toolkits.mplot3d import Axes3D # 生成数据点 k = np.linspace(-4 * np.pi, 4 * np.pi, 100) z = np.linspace(-2, 2, 100) r = z**2 + 1 x = r * np.sin(k) y = r * np.cos(k) fig = plt.figure() ax = fig.add_subplot(111, projection='3d') ax.plot(x, y, z, color='b', linewidth=1) ax.set_xlabel('X') ax.set_ylabel('Y') ax.set_zlabel('Z') ax.set_title('3D Wireframe Plot') plt.show()输出:
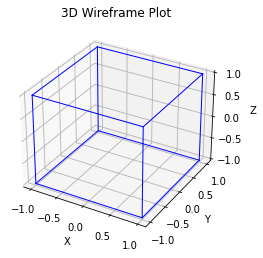
首先我们先生成了一些数据点,这里k表示角度变量,范围从-4π到4π,用来控制点在水平方向上的位置;z表示的高度,范围从-2到2。r是一个根据z计算的半径变量,用来控制点在极坐标系中的距离。通过调整参数的范围和函数关系,我们可以生成各种不同形状的曲线,从简单的圆形和螺旋形到复杂的曲线形状。 然后,使用ax.plot函数绘制3D线框图。将生成的x、y和z数据作为参数传递给plot函数,设置线条颜色为蓝色(color='b')和线条宽度为1(linewidth=1)。这样就绘制了连接数据点的线条。接下来,我们通过ax.set_xlabel、ax.set_ylabel和ax.set_zlabel函数设置X、Y和Z轴的标签,通过ax.set_title函数设置图形的标题。 2. 绘制正方体及更改样式接下来我们可以根据正方体的坐标和线条在三维图像上绘制一个正方体: import numpy as np import matplotlib.pyplot as plt from mpl_toolkits.mplot3d import Axes3D vertices = np.array([ [-1, -1, -1], [1, -1, -1], [1, 1, -1], [-1, 1, -1], [-1, -1, 1], [1, -1, 1], [1, 1, 1], [-1, 1, 1] ]) edges = [ [0, 1], [1, 2], [2, 3], [3, 0], [4, 5], [5, 6], [6, 7], [7, 4], [0, 4], [1, 5], [2, 6], [3, 7] ] fig = plt.figure() ax = fig.add_subplot(111, projection='3d') for edge in edges: ax.plot([vertices[edge[0]][0], vertices[edge[1]][0]], [vertices[edge[0]][1], vertices[edge[1]][1]], [vertices[edge[0]][2], vertices[edge[1]][2]], color='b', linewidth=1) ax.set_xlabel('X') ax.set_ylabel('Y') ax.set_zlabel('Z') ax.set_title('3D Wireframe Plot') plt.show()输出:
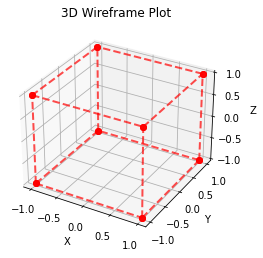
在这里vertices(顶点)变量定义了一个立方体的顶点坐标,包括立方体的8个顶点。每个顶点的坐标表示为[X, Y, Z]的形式。在这个例子中,edges定义了立方体的边。它包括了立方体的12条边,每个边由两个顶点的索引构成。例如,[0, 1]表示连接顶点0和顶点1的边。后面我们使用一个循环遍历边列表,对于每一条边,我们根据顶点的坐标值绘制线段。具体来说,我们提取边连接的两个顶点的坐标,将其作为X、Y和Z坐标的值传递给plot函数,绘制线段。这样我们就绘制了一个立方体的线框图,展示了立方体的六个面和十二条边。我们也可以通过修改顶点和边的定义来绘制其他形状的3D线框图。 我们还可以通过更改ax.plot函数内的参数,为线框图提供更多选择。比如: 调整线条颜色: ax.plot(..., color='red')调整线条粗细: ax.plot(..., linewidth=2)添加线条标记: ax.plot(..., marker='o')调整线条透明度: ax.plot(..., alpha=0.5)调整线条样式: ax.plot(..., linestyle='--')根据上述样式调整,我们可以绘制一个不同样式的正方体: import numpy as np import matplotlib.pyplot as plt from mpl_toolkits.mplot3d import Axes3D vertices = np.array([ [-1, -1, -1], [1, -1, -1], [1, 1, -1], [-1, 1, -1], [-1, -1, 1], [1, -1, 1], [1, 1, 1], [-1, 1, 1] ]) edges = [ [0, 1], [1, 2], [2, 3], [3, 0], [4, 5], [5, 6], [6, 7], [7, 4], [0, 4], [1, 5], [2, 6], [3, 7] ] fig = plt.figure() ax = fig.add_subplot(111, projection='3d') for edge in edges: ax.plot([vertices[edge[0]][0], vertices[edge[1]][0]], [vertices[edge[0]][1], vertices[edge[1]][1]], [vertices[edge[0]][2], vertices[edge[1]][2]], color='red', linewidth=2, linestyle='--', marker='o', alpha=0.7) ax.set_xlabel('X') ax.set_ylabel('Y') ax.set_zlabel('Z') ax.set_title('3D Wireframe Plot') plt.show()输出:
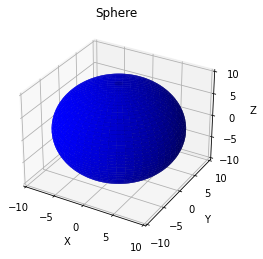
同理,我们可以绘制不同的3D图形: 球体: import numpy as np import matplotlib.pyplot as plt from mpl_toolkits.mplot3d import Axes3D # 创建球体的顶点坐标 u = np.linspace(0, 2 * np.pi, 100) v = np.linspace(0, np.pi, 50) x = 10 * np.outer(np.cos(u), np.sin(v)) y = 10 * np.outer(np.sin(u), np.sin(v)) z = 10 * np.outer(np.ones(np.size(u)), np.cos(v)) # 创建画布和坐标轴 fig = plt.figure() ax = fig.add_subplot(111, projection='3d') # 绘制球体 ax.plot_surface(x, y, z, color='b') # 设置坐标轴范围和标签 ax.set_xlim(-10, 10) ax.set_ylim(-10, 10) ax.set_zlim(-10, 10) ax.set_xlabel('X') ax.set_ylabel('Y') ax.set_zlabel('Z') # 设置图形标题 ax.set_title('Sphere') # 显示图形 plt.show()输出:
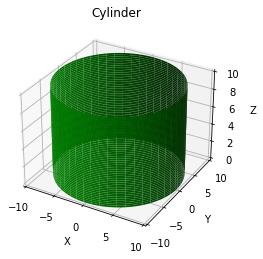
圆柱体: import numpy as np import matplotlib.pyplot as plt from mpl_toolkits.mplot3d import Axes3D # 创建圆柱体的顶点坐标 theta = np.linspace(0, 2 * np.pi, 100) height = np.linspace(0, 10, 50) theta, height = np.meshgrid(theta, height) x = 10 * np.cos(theta) y = 10 * np.sin(theta) z = height # 创建画布和坐标轴 fig = plt.figure() ax = fig.add_subplot(111, projection='3d') # 绘制圆柱体 ax.plot_surface(x, y, z, color='g') # 设置坐标轴范围和标签 ax.set_xlim(-10, 10) ax.set_ylim(-10, 10) ax.set_zlim(0, 10) ax.set_xlabel('X') ax.set_ylabel('Y') ax.set_zlabel('Z') # 设置图形标题 ax.set_title('Cylinder') # 显示图形 plt.show()输出:
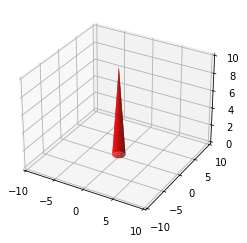
椎体: import numpy as np import matplotlib.pyplot as plt from mpl_toolkits.mplot3d import Axes3D # 创建锥体的顶点坐标 theta = np.linspace(0, 2 * np.pi, 100) height = np.linspace(0, 10, 50) theta, height = np.meshgrid(theta, height) radius = (10 - height) / 10 x = radius * np.cos(theta) y = radius * np.sin(theta) z = height # 创建画布和坐标轴 fig = plt.figure() ax = fig.add_subplot(111, projection='3d') # 绘制锥体 ax.plot_surface(x, y, z, color='r') # 设置坐标轴范围和标签 ax.set_xlim(-10, 10) ax.set_ylim(-10, 10) ax.set_zlim(0, 10) 输出:
|
【本文地址】
今日新闻 |
推荐新闻 |